John Mauldin is not prone to exaggeration or hyperbole. From Mauldin via zerohedge.com:
As I look out over the coming years, I am convinced that we’ll see the blowing up of the biggest bubbles in history – including those of government debt and government promises. And it’s not just in the US, but all over the world.
That will lead to an eventual global crisis of biblical proportions. Although, it isn’t clear what the immediate cause of the crisis will be.
Let’s start with some basics
The most common way to measure valuation is with the price-to-earnings ratio (P/E). Analysts compile P/E and other indicators from many companies to give us valuation metrics on entire markets and indexes.
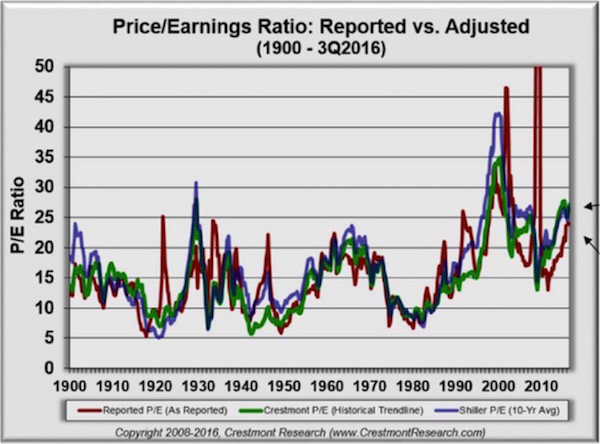
You can see overvaluation and undervaluation in this chart from my friend Ed Easterling of Crestmont Research.
The red line is the combined P/E ratio of the S&P 500 as originally reported. The green and blue lines are adjusted Crestmont and Shiller versions, which occasionally diverge. The P/E ratio spent most of the last century between 10 and 25.
Presently, all three P/E versions are near or above 25, indicating overvaluation. This doesn’t mean the end is near—though it could be. But it does suggest that we are not at the beginning of another long-term bull market.
P/E adjusted to economic growth
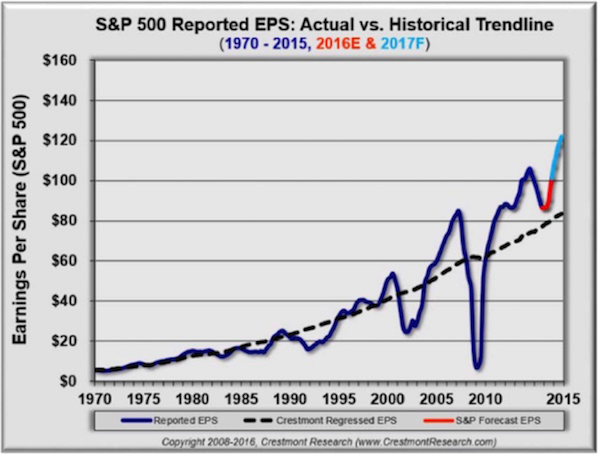
The next chart illustrates the past and present trend in a different way.
Direct your attention to the dashed line.
It’s Ed’s long-term earnings baseline, which he adjusts to reflect the relationship of earnings to economic growth. Reported earnings per share go below the baseline during bear markets and above it in bullish periods. Currently, it is way above trend and is projected by S&P and many others on Wall Street to become even more so.
To continue reading: 6 Charts That Make The Case We Are In Long-Term Secular Bear