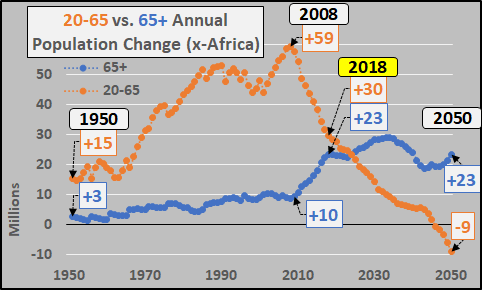
Demographic charts say deleveraging, deflation, and depression are in our future. Read ’em and weep. From Chris Hamilton at econimica.blogspot.com:
First, chart of the century…literally. For those engrossed in the current and engulfing repo fiasco, QE, and monetization…it is helpful to pull back and clarify what it is that is causing the existing economic and financial system to fail? It was, is, and will be a Ponzi to its last day and Ponzi’s fail for lack of new suckers. In this case, those willing and able to undertake new credit (debt) that enlarges the money supply in our fractional reserve system. The chart below shows the global annual growth of the 20 to 65 year-olds versus 65+ year-olds (both excluding Africa). 20 to 65 year-olds world over utilize credit (debt) while 65+ year-olds extinguish debt (deleverage). So long as the growth of those levering up outstripped those deleveraging, the system could continue. But as you’ll note, in 2008, the entire global system shuddered as accelerating growth of potential workers ceased and began decelerating…while the growth of non-workers accelerated. By about 2024, the annual growth of non-workers (deleveragers) will overtake annual growth of potential workers (debtors). Those rapidly extinguishing debt in old age will outnumber those undertaking the new debt. Those in retirement or in death offloading assets will outnumber those buying those assets. The non-technical name for this is a “shit-show” and this is why central banks, federal governments, and ultra wealthy are aligning ever tighter to save themselves.

