Tag Archives: Unemployment statistics

The Weird Phenomenon of “Labor Shortages” as Millions of People Who Could Work Are Not Working, by Wolf Richter

Wolf Richter does a good job of making sense of seemingly nonsensical statistics. From Richter at wolfstreet.com:

A sign of how messed up the moving parts of the economy have become, amid massive excesses and distortions connected by malfunctioning gearing.

In an interview a few days ago that aired locally, the owner of an Italian restaurant in San Francisco – the restaurant scene is now vibrant in a different way than before – put her struggles with hiring on the table. The kitchen staff had come back, she said, but she had trouble hiring back the staff for the front of the restaurant, the wait staff, who are normally fairly well paid via tips.

She said that many of these people have other dreams. They were artists or writers or students or entrepreneurs, or whatever, and waiting tables wasn’t their career, it was just a way to make ends meet. And many of them had moved on during the pandemic or were using their unemployment benefits to push their dreams forward, rather than returning to restaurant work.

Employment in food services and drinking places rose by 186,000 in May from April, according to the Bureau of Labor Statistics today. In the leisure and hospitality industry overall – which also includes hotels and casinos – employment jumped by 292,000 in May, and has been gaining all year as restaurants and hotels reopened, but was still down by 2.5 million people compared to the peak in February 2020.

Surrendered Without A Shot, by Robert Gore

The Global War on Germs will put the Global War on Terror to shame.

Their “cure” for the coronavirus will be far deadlier than the disease. The quarantines and lockdowns will bring the world to a standstill—that’s the point….

The Last Gasp,” Straight Line Logic, March 24, 2020

Here is a predictive strategy that will, guaranteed, improve your prognostication batting average. Whenever you make a prediction about a government, predict the worst outcome you can think of. The only surprise will be that you’re probably not pessimistic enough.

Back in 1913, if you had predicted the brand new Federal Reserve would steadily debase the currency and exacerbate rather than dampen the business cycle, you were dead right. You would have gotten more points if you predicted its creation was the first step towards abandoning the gold standard and that it would eventually finance government deficits.

Similarly, back in that unlucky year if you predicted the new Constitutional amendment allowing the government to levy an income tax would lead to massive confiscation of incomes and fund gargantuan welfare and warfare states—the blob—you hit it on the screws.

Later, if you predicted that the New Deal wouldn’t reverse the economic contraction that the government had already transformed from a garden variety financial crash and recession into a Great Depression, you were right again. More points for those who foresaw both the abandonment of any effective Constitutional constraints on the federal government, and the fiscal consequence of welfare state collectivism—a spiraling and uncontrollable national debt.

Amazon Paperback Link

Kindle Ebook Link

Continue reading

The US Jobs Market Is Much Worse Than The Official Data Suggest: The Full Story, by Morningside Hill

This is the best systematic review SLL has seen of the flaws and deficiencies in US employment statistics. From Morningside Hill via zerohedge.com:

Following Friday’s disappointing payrolls report, yesterday we showed another even more troubling fact about the state of the US labor market: since 2008, over 93% of the total 6.7 million net jobs “created” in the past decade, have been statistical, existing simply inside an excel model somewhere in the US Department of Labor, as a result of the BLS’ favorite fudge factor, the Birth/Death adjustment.

Unfortunately, that’s just the tip of the iceberg for why the US labor market “recovery” is perhaps the biggest ‘fake news’ of the US economic narrative, and as a comprehensive recent analysis issued by Morningside Hill reveals, the state of the US jobs market is far worse than the official data suggest.

Here is the real story.

The US jobs market has been described as the backbone of the recovery – 80 months of continuous jobs growth with unemployment hitting 4.3% – the lowest since 2001. However the perceived strength in jobs creation is at odds with other economic indicators. President Trump ran on a campaign that repeatedly touted “jobs, jobs, jobs.” His emphasis on jobs creation and bringing employment back to America struck a chord with voters. Trump’s election in itself contradicts the popular narrative that the US jobs market is tight and robust. Wages, disposable income and real earnings growth along with low productivity and overall slow economic growth all challenge the BLS’s jobs numbers and thus Wall Street’s perception that the jobs market is tight.

Since the monthly jobs report is eagerly awaited as the most important piece of economic data for financial markets, it warrants a deep dive in order to understand what is going on under the hood. Before we delve into the data, here are some highlights of our findings.

To continue reading: The US Jobs Market Is Much Worse Than The Official Data Suggest: The Full Story

Since 2014 The US Has Added 547,000 Waiters And Bartenders And Lost 32,000 Manufacturing Workers, by Tyler Burden

The media always focuses on the numbers in the unemployment statistics, but rarely the qualitative factors, like what kinds of jobs is the US economy generating. From Tyler Durden at zerohedge.com:

As another month passes, the great schism inside the American labor force get wider. We are referring to the unprecedented divergence between the total number of high-paying manufacturing jobs, and minimum-wage food service and drinking places jobs, also known as waiters and bartenders. In September, according to the BLS, while the number of people employed by “food services and drinking places” rose by another 30,000, the US workforce lost another 13,000 manufacturing workers.

The chart below puts this in context: since 2014, the US had added 547,000 waiters and bartenders, and has lost 32,000 manufacturing workers.

Yet while we would be the first to congratulate the new American waiter and bartender class, something does not smell quite right. On one hand, there has been a spike in recent restaurant bankruptcies or mass closures (Logan’s, Fox and Hound, Bob Evans), which has failed to reflect in the government report. However, what we find more suspect, is that according to the BLS’ seasonally adjusted “data”, starting in March of 2010 and continuing through September of 2016, there has been just one month in which restaurant workers lost jobs, and alternatively, jobs for waiters and bartenders have increased in 78 out of the past 79 months.

Putting this divergence in a long context, since the official start of the last recession in December 2007, the US has gained 1.7 million waiters and bartenders, and lost 1.5 million manufacturing workers. Worse, while the latter series had been growing, if at a slower pace than historically, it has now clearly rolled over, and in 2016, some 58,000 manufacturing jobs have been lost.

Like last month, we remain curious what this “data” series will look like after it is revised by the BLS shortly after the NBER declares the official start of the next recession.

http://www.zerohedge.com/news/2016-10-07/2014-us-has-added-547000-waiters-and-bartenders-and-lost-32000-manufacturing-workers


New Report Proves What We Already Knew – The U.S. Economy Sucks, by Michael Krueger

There is no more manipulated and massaged economic statistics than the unemployment numbers. From Michael Krieger at libertyblitzkrieg.com:

I’m surprised it took this long, but it’s finally become mainstream thinking to acknowledge that the official unemployment rate is little more than nonsensical propaganda. As the emergence of massive populist movements on both the “right” and the “left” have demonstrated, something ain’t right in the U.S. economy, and everyday people get it.

Bloomberg reports:

Democrats typically cite the current unemployment rate of 4.9 percent as evidence of significant economic improvement since the last recession, but a report this week from the left-leaning Center for Economic and Policy Research says otherwise.

Author and research associate Nick Buffie looked beyond the main jobless rate to more than a half-dozen measures including prime-age employment, labor compensation and the rate at which workers are quitting their jobs. When you factor these in, “the economy is weaker than the unemployment rate says and we haven’t fully recovered from the recession yet,” Buffie says.

In 2007, the year the recession began, the prime-age employment rate — defined as the percentage of Americans age 25 to 54 with a job — was 79.9 percent. The share fell to 74.8 percent in December 2009 and remained low until it began rising two years later, reaching 77.8 percent in June 2016.

Based on these numbers, the labor market has only recovered about three-fifths of the employment lost during the recession, according to Buffie.

Since the unemployment rate peaked in 2009 at 10 percent, about 12.7 million workers have found work, while an additional 11.8 million Americans have given up on their job search altogether. The report suggests that many currently unemployed Americans would resume work if given the opportunity.

The number of so-called “job wanters” — which are prospective workers who wants jobs but haven’t searched for one within the past four weeks — is up 25 percent since 2007. Of those, the number of “marginally attached workers” — defined as a prospective worker who wants a job, is available to work now, and searched for employment within the past year but not the past four weeks — is up 31 percent. There were also 64 percent more “discouraged workers,” or marginally attached workers who had given up looking for work specifically because they didn’t think any jobs were available.

Meanwhile, the AEI came up with a neat little infographic on the subject. Here’s how they introduce it:

More people—but especially men in their prime—are out of work than ever before. Nicholas Eberstadt, America’s leading demographer and political economist, exposes this reality with fresh, detailed demographic data. He concludes that there is a new population of men—beyond the “employed” and “unemployed”—that are “unemployed but not looking for work.” Who are these men? Why are they not looking for work? And how has the welfare state influenced, contributed to, or even exacerbated the reality of this new class of men? “Men Without Work” pays particular attention to this group, presenting a clear, researched look at what all Americans can no longer ignore.

http://libertyblitzkrieg.com/wp-content/uploads/2016/09/Screen-Shot-2016-09-21-at-2.35.44-PM-768×455.jpg

To continue reading: New Report Proves What We Already Knew – The U.S. Economy Sucks

Why this Job Market is Still Terrible: The Politically Incorrect Numbers Everyone is Hushing up, by Wolf Richter

On a per capita basis, the job market has shown little improvement since the last financial crisis. From Wolf Richter at wolfstreet.com:

For individuals, it has barely improved since the Great Recession.

If you have a salary well into the six figures, stock options, nearly free healthcare, and other benefits such as access to free gourmet lunches and dinners at the company’s food court, you might have missed something that a lot of folks feel every day: It’s still a very tough battle out there in this job market. And here is why.

Today we got what was called a “stellar jobs report”: Non-farm payrolls rose 255,000 in July. In the other component of the report, the household survey showed that 420,000 new jobs were created. There are now a record 123.9 million full-time jobs. Government hiring was strong. Numerous sectors added to payrolls. And the unemployment rate remained stuck at 4.9%, with 7.8 million people deemed officially unemployed.

So everyone was happy. Well, certainly the stock market was. The S&P 500 closed at a new high. The Treasury market started worrying about a Fed rate hike, and the 10-year yield rose to 1.59%

But on an individual basis, on a per-capita basis – and this is what people feel when they’re looking for a job or asking for a raise – these “stellar” figures depict a job market that is only a little better than at the worst moment of the Great Recession.

On its population clock, the Census Bureau estimates that the US population on August 5, 2016, at 4:49 p.m. ET (yup, down to the minute) was 324.17 million.

That’s up from 308.76 million in April 2010. Since the darkest days of the Great Recession, the US population has grown by 15.4 million.

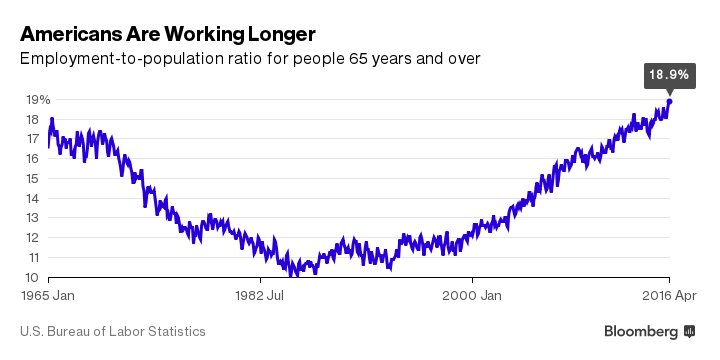
The Census Bureau also estimates that there are currently 8.6 births per minute, minus 4.6 deaths per minute, plus 2 arriving immigrants (“net”) per minute, for a gain of nearly 6 folks per minute. Everyone ages, so the young ones move into the labor force, but the baby boomers are fit and healthy and don’t feel like retiring, and so they hang on to their jobs for as long as they can, despite the rampant age discrimination they face in many sectors, particularly in tech, though obviously not in politics.

In 2010, 24% of the people were under 18. That was 74 million people. Millions of them have since moved into the labor force, elbowing each other while scrambling for jobs, as have those millions who were then between 18 and their twenties and in college or grad school. These millennials have arrived on the job market in very large numbers.

In April 2010, there were 130.1 million nonfarm payrolls. In today’s July report, there were 144.4 million. Hence, 14.3 million jobs have been added to the economy over the time span, even as the total population has grown by 15.4 million. So that’s not working out very well.

On average, 205,300 jobs need to be created every month just to keep up with population growth and not allow the unemployment situation to get worse.

So clearly, for individuals who aren’t lucky, the employment math is very tough. The Bureau of Labor Statistics attempts to capture this dismal condition with its Employment-Population Ratio. It measures the proportion of employed persons to the civilian non-institutional population aged 16 years and over.

To continue reading: Why this Job Market is Still Terrible: The Politically Incorrect Numbers Everyone is Hushing up

Fake Jobs Plague the U.S. Economy, by James Dale Davidson

Markets anxiously wait on the first Friday of every month for the release of unemployment numbers that are basically fabrications. Which is why SLL pays little attention to them and lets others dope out the mendacity. Here’s a great doping out by James Dale Davison at thesovereigninvestor.com:

“When it becomes serious, you have to lie.” — Jean-Claude Junker, President of the European Commission.

Normally, I would not bring a European politician into a discussion about the U.S. economy. But in this case, European Commission President Jean-Claude Junker has “let the cat out of the bag.” In an unguarded moment, Junker let slip the working principle that guides politicians everywhere.

Think about it.

Is there any more serious issue for U.S. politicians than convincing you to give them your vote? You know that most voters in our intervention-addicted world credit politicians for prosperity they enjoy during their time in power. Just as primitive tribes credit the local chief or high priest for prosperity — or blame his sins when bad weather or pestilence make living conditions difficult.

Is there any more serious issue for you than understanding how you can preserve and build your capital in an uncertain world? Without capital, you are in danger of sinking to the level of the billions of Indians and Chinese whose livelihoods depend on their ability to rent their time. Not a happy prospect.

A crucial characteristic of the world that could make both the politicians’ dreams of power and your dreams of secure retirement come true would be the resumption of rapid economic growth — as reflected in both GDP accounting and employment reports.

Unhappily, the news on that score is far from encouraging…

In fact, a close reading of the data suggests that economic growth is negligible, and the real unemployment rate is about 23%.

That is the Shadow Government Statistics alternative unemployment rate for May 2016. Quite a contrast with the headline “official” unemployment rate of 4.7%.

But upon inspection, you can see that the alarming 23% ShadowStats unemployment rate is merely unemployment calculated as it was until the Kennedy administration, when out-of-work Americans who had suspended an active search for jobs — primarily because none could be found — were relabeled “discouraged workers” and dropped from the tally of the unemployed.

The Clinton administration widened the memory hole further.

In 1994, the Bureau of Labor Statistics (BLS) redefined the workforce to exclude all but the small percentage of the discouraged who had been seeking work for less than a year. The longer-term discouraged — some 4 million U.S. adults — disappeared into a statistical black hole.

Clinton also reduced the sample-sized employed in the household survey that determines the unemployment rate — excluding a disproportionate share of inner-city households who were less likely to have jobs.

Over the years, American politicians have used statistical sleight of hand to protect themselves from the angry mobs of voters in a way that the witch doctors and high priests of the past could only envy.

In the old days, when the rains didn’t come and the crops failed, the high priests could not fool anyone by merely issuing a proclamation thanking the gods for bumper crops.

Today, Obama proclaims a “vigorous recovery” and The New York Times pretends to believe it.

To continue reading: Fake Jobs Plague the U.S. Economy


What Makes this Jobs Report so Truly Ugly? by Wolf Richter

Another take on the jobs numbers released this morning, from Wolf Richter at wolfstreet.com:

The thing about population growth.

It would have been nice if we’d been correct to the minute, but we were two months early, and therefore wrong, when we wrote on March 30, If This Plays Out, Friday Will Get Ugly.

But it did play out today.

At the time, we suspected that the March jobs report, released in early April, would be a debacle. We based this on an analysis of the divergence over time between the reports issued by payroll processing company ADP and the jobs reports issued by the Bureau of Labor Statistics. That divergence had been going on for months. Eventually it reverts to the mean. We postulated that March would be that month.

Instead, it happened two months behind schedule, so to speak, as today’s jobs report was precisely that sort of debacle.

This is what was “expected”:

The Labor Department was expected to report, according to Wall Street economists, a “moderate” gain of 158,000 jobs in May, “moderate” given that the Verizon strike kept 35,000 workers off their jobs. The “whisper number” was around 200,000 jobs.

And this is what we got:

The BLS reported that the economy had added 38,000 jobs, the lowest since September 2010. Furthermore, the April job gains of 160,000 were chopped down by 37,000 and the March job gains of 208,000 were chopped down by 22,000. Hence, with 59,000 jobs revised away, and with only 38,000 jobs “created” in May, the net total in today’s report was a net loss of 21,000 jobs. We haven’t seen that since the Financial Crisis.

“Shockingly weak,” and “In one word, ‘Ouch’” is how MarketWatch put it so elegantly.

It was ugly all around. A number of sectors, including manufacturing, shed jobs, and the labor participation rate dropped for the second month in a row, to 62.6%. Just about the only good number was the magic headline unemployment rate, which fell sharply, from 5% in April to 4.7%, the lowest since the Great Recession began, leaving some folks scratching their heads and searching for answers.

But here’s where the report really spread gloom:

The number of temporary jobs plunged by another 21,000. Temporary employment is a harbinger for future employment trends, on the way up and on the way down.

The temporary-help sector was a major – and much lamented – driver of jobs growth after the Financial Crisis. The sector began adding jobs in September 2009. It was an early sign that companies were starting to hire again but didn’t want to commit to more permanent jobs, even as the economy overall continued shedding jobs until February 2010.

To continue reading: What Makes this Jobs Report so Truly Ugly?

Funniest BLS Report Ever, by Jim Quinn

SLL does not spend much time on government statistics because they’re mostly propaganda and because statistics are boring. Besides, there are already people in the blogosphere who do an excellent job of taking apart the government’s numbers, especially the monthly unemployment stats. One of the best is SLL Jim Quinn at theburningplatform.com: 

Only a captured government drone could put out a report showing only 38,000 new jobs created, with the working age population rising by 205,000, and have the balls to report the unemployment rate plunged from 5.0% to 4.7%, the lowest since August 2007. If you ever needed proof these worthless bureaucrats are nothing more than propaganda peddlers for the establishment, this report is it. The two previous months were revised significantly downward in the fine print of the press release.

It is absolutely mind boggling that these government pond scum hacks can get away with reporting that 484,000 people who WERE unemployed last month are no longer unemployed this month. Life is so fucking good in this country, they all just decided to kick back and leave the labor force. Maybe they all won the Powerball lottery. How many people do you know who can afford to just leave the workforce and live off their vast savings?

In addition, 180,000 more Americans left the workforce, bringing the total to a record 94.7 million Americans not in the labor force. The corporate MSM will roll out the usual “experts” to blather about the retirement of Baby Boomers as the false narrative to deflect blame from Obama and his minions. The absolute absurdity of the data heaped upon the ignorant masses is clearly evident in the data over the last three months. Here is government idiocracy at its finest:

Number of working age Americans added since March – 406,000

Number of employed Americans since March – NEGATIVE 290,000

Number of Americans who have supposedly voluntarily left the workforce – 1,226,000

Unemployment rate – FELL from 5.0% to 4.7%
Talk about perpetrating the BIG LIE. Goebbels and Bernays are smiling up from the fires of hell as their acolytes of propaganda have kicked it into hyper-drive. We only need the other 7.4 million “officially” unemployed Americans to leave the work force and we’ll have 0% unemployment. At the current pace we should be there by election time. I wonder if Cramer, Liesman, or any of the other CNBC mouthpieces for the establishment will point out that not one single full-time job has been added in 2016. There were 6,000 less full-time jobs in May than in January, while there are 572,000 more low paying, no benefits, part-time Obama service jobs. Sounds like a recovery to me.

It gets even better. The birth death excel spreadsheet “adjustment” added 224,000 phantom jobs into the May calculation. The lies – they burn. We know for a fact more businesses are closing than opening since the 2008 financial crisis. This model assumes more openings than closings. IT’S ADJUSTMENT IS DEAD WRONG. In reality, jobs should be subtracted from the total. It added 231,000 phantom jobs in April too. The jobs numbers are much worse than the bad numbers being reported.

When you see lies, misinformation and deceitfulness at this level, you have to ask yourself whether this entire debt supported house of cards is about to fall. The smell of desperation is in the air. The MSM stories about a booming economy are rolled out on a daily basis. Meanwhile, the average family is being crushed by Obamacare, rising rents, rising food costs, and no interest on any savings they might have left.

It also seems awfully suspicious that within seconds of the awful report, the faux journalists immediate reaction was NO FED RATE HIKE in June or July. These pundits of propaganda want the ignorant masses to think a .25% increase in interest rates actually matters to the economy or the average person. We’ve had ZIRP for almost seven years and the economy blows. Rates have been at emergency levels as the establishment has flogged the economic recovery story to death. There has been no recovery for the average person. The recovery has been for Wall Street and the sycophants who suck off their teat.

To continue reading: Funniest BLS Report Ever

Hard Times & False Narratives, by Jim Quinn

SLL is not the only one who believes America has been in a humungous depression since the turn of the century. From Jim Quinn at theburningplatform.com:

The mainstream media mouthpieces for the establishment peddle false narratives, disingenuous storylines, and outright propaganda to keep the ignorant masses confused, oblivious to reality, misinformed, and passively submissive to the opinions of highly paid “experts” and captured fiscal authorities. The existing social order likes things just as they are.

They reap ill-gotten riches, wield unchecked power, and control the minds of the masses. They are the invisible government consciously manipulating the minds, habits and opinions of the multitudes in order to dominate society, control the levers of government, and accumulate obscene levels of wealth through manipulation of the currency and domination of the banking and corporate interests.

One of the false narratives being flogged by the establishment propaganda peddlers is the mass retirement of Baby Boomers causing the plunge in the employment to population rate from 64.4% in 2000 to 59.7% today. They need to peddle this drivel, because the difference between these two rates amounts to 12 million missing jobs. The employment to population ratio is currently at 1984 levels. Any critical thinking person with basic math skills realizes the government reported unemployment rate of 5% is an Orwellian farce.

Over 40% of working age Americans aren’t working, amounting to 102 million people, and the establishment touts the ludicrous lie of a 5% unemployment rate. With only 123 million Americans employed full-time and virtually all the job “growth” since 2009 in non-producing low paying service jobs in the retail, restaurant, hospitality and healthcare industries, wages and household income remain stagnant. The 12 million shortfall in jobs isn’t due to Boomers retiring, as this chart proves beyond a shadow of a doubt. Only an Ivy League educated economist or CNBC talking head could pretend to be confused.

We know for a fact 10,000 Americans have been turning 65 years old every day for the last few years and will for the next fifteen years. When the employment to population ratio peaked in 2000 at 64.4%, the ratio for senior citizens was only 12%. It had remained between 10% and 12% for over two decades. There were 35 million Americans over 65 years old in 2000, and 31 million of the them were not employed. They made up a large portion (44%) of the 70 million people not in the labor force.

Today there are 48 million Americans over 65 years old, and 39 million of them are not employed. The establishment narrative is blown to smithereens by the FACT they now only account for 41% of the 94 million people not in the labor force. There are only 14 million more employed Americans today than in the year 2000, while there are 5 million more employed Americans over the age of 65. They have accounted for 36% of all the jobs created in the last 16 years. The percentage of senior citizens working is at an all-time high of 18.9% and rising.

The narrative of retiring Baby Boomers being the cause for the plunging participation rate is entirely false. The data is not hidden. It’s easily accessible. Any CNBC pundit, Wall Street Journal reporter, or Ivy League MBA Wall Street analyst with even a smattering of math skills could discern the truth. Based on the fact they continue to flog false narratives, makes you believe their job and intent is to obscure the truth, obfuscate the facts, and paint a rosy picture for their establishment bosses. There are almost 4 million less Americans aged 16 to 55 employed today than there were in 2007. Does that happen in an economic recovery?

To continue reading: Hard Times & False Narratives